
Showcasing the Library, Showcasing Research
UITS Data Visualization, the CATalyst Studios and university researchers put on an impressive display.
The Library’s Data Studio and Viz Wall are reservable by all members of the campus community.
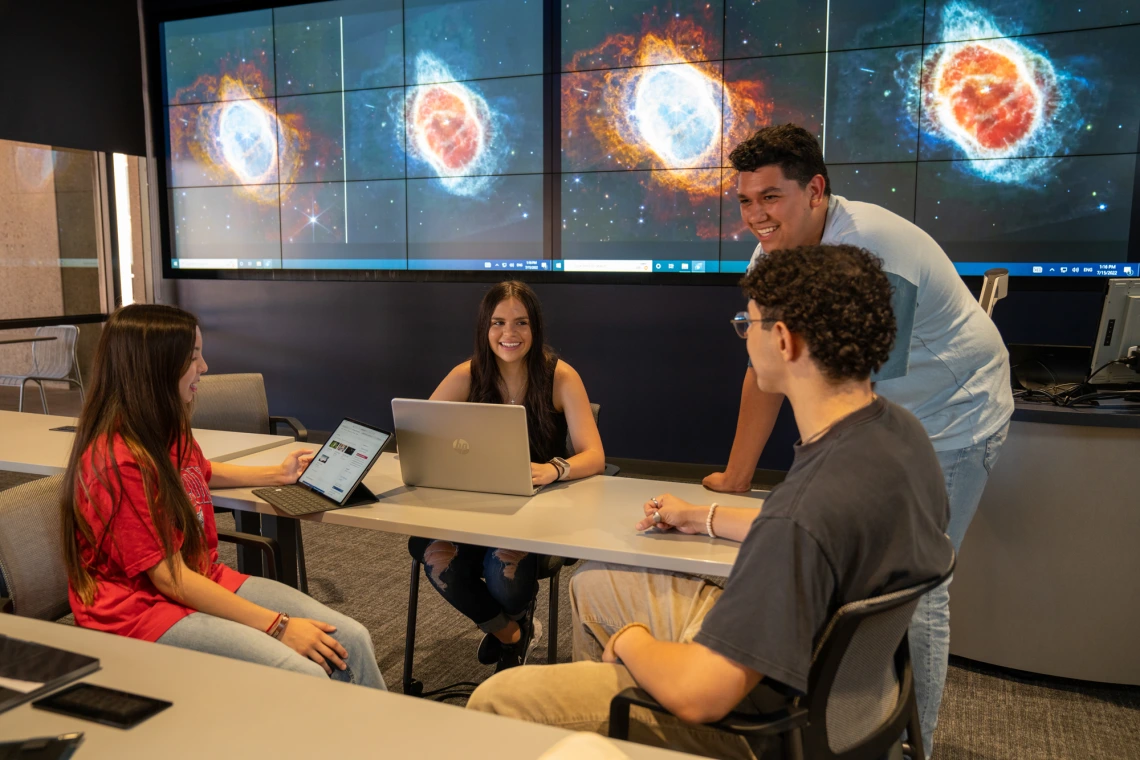
University Libraries Dean Shan Sutton arranged a tour of the Main Library for new President Suresh Garimella on April 23. The CATalyst Studios near the front doors make an impressive visual impact, especially when the large Viz Wall in the Data Studio has a display up.
CATalyst Studios director Jen Nichols contacted Devin Bayly for help with content for the screens during the President’s tour. Devin is a data/visualization consultant for UITS Research Technologies and collaborates with Library staff regularly. He was able to collaborate with some of the researchers he works with on visualizations to highlight on the display.
Researchers Highlighted
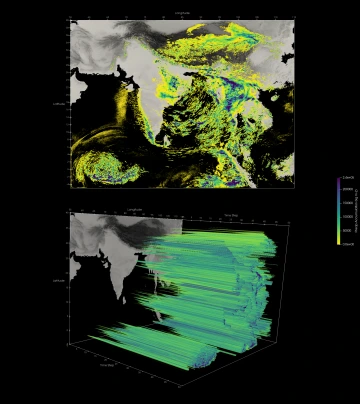
Sylvia Sullivan, an assistant professor in Chemical and Environmental Engineering, is working on atmospheric science studies of ice clouds and storms. Her group runs very high-resolution simulations of storms using the UITS high-performance computing cluster (HPC) and the DKRZ supercomputer in Hamburg Germany that she's affiliated with. The terabytes of data generated are then post-processed and visualized on the UA HPC.
Devin has assisted her with expanding 2-dimensional information through time into a 3D representation. She tracks typhoons and cloud formations in Southeast Asia, which caught the President’s interest during his tour.
PhD student Tyler Trent is studying Astrophysics using computational models. After contributing to the Event Horizon Telescope’s first image of a black hole, he has continued black hole studies, including tracking plasma and magnetic particles pulled into them, which are normally viewed in 2D slices. A simulation generated by Mark Avara, a post-doctoral researcher at Georgia Tech, provided a wealth of data.
But just as a series of MRI images don’t look like a brain, Tyler was looking for a more cinematic visualization of a black hole. Devin assisted Tyler in using the Blender open-source 3D modeler on the UITS HPC resources to create the video shown to President Garimella. The total run time for only 250 frames would have been close to an hour or more to process, but Devin leveraged the parallel computing systems available to render all the frames at the same time and then stick them together as an animation in minutes.
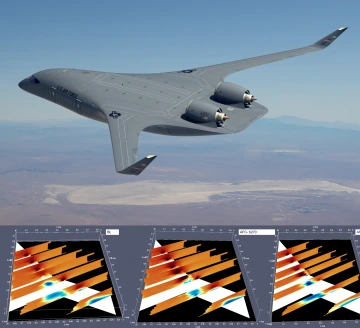
Harshad Kalyankar is an Aerospace & Mechanical Engineering postdoctoral research associate. He is exploring blended wing body (BWB) design aircraft, which are generating interest for their ability to reduce fuel use and carbon emissions in flying. A disadvantage to these configurations’ wing shape and tailless design can cause instability.
Harshad’s research investigates novel ways of altering the structure, trajectory, and interactions of the leading edge of the wings to enable on-demand control and making small modifications to reduce instability. He collects data using physical experiments in a wind tunnel and then performs analysis and creates visualizations on the UITS HPC. Devin helps him create visualizations of airspeed over parts of the plane he can determine the most effective modifications.
Devin was excited to help show off the Library’s resources and his and his researchers’ work to President Garimella. He regularly collaborates with the Library’s Data Cooperative and is at the Library’s CATalyst Data Studio every Tuesday for the Data & Viz Drop-in where he helps students learn about data visualization.
Whether he is helping researchers using data from the UITS HPC or other sources, or introducing students to data visualization, Devin works to find the best way to tell the data’s story in images. He says, “There are no bad visualizations, but there are visualizations that don’t serve a goal.”